“Nothing else out there observes anomalies in Kubernetes like Blue Matador. The intercluster visibility is really good. With a tool like Prometheus, you’d have to figure that all out yourself.”
– Michael Goode, Lead Platform Operations Engineer at Pinpoint

| Blue Matador | Prometheus |
| Total setup time |
Full monitoring coverage in <20 mins |
Weeks to set up, years to maintain |
| Alert setup |
Automated |
Manual |
| Management |
Fully managed by us |
Managed by you (upgrades / updates / patches / releases) |
| Anomaly detection |
Yes |
No |
| Automated insights |
Yes |
No |
| Automated alert severity triage |
Yes |
No |
| Graph visualizations |
Native |
Grafana / Kibana |
| Cloud monitoring |
AWS & Azure | No |

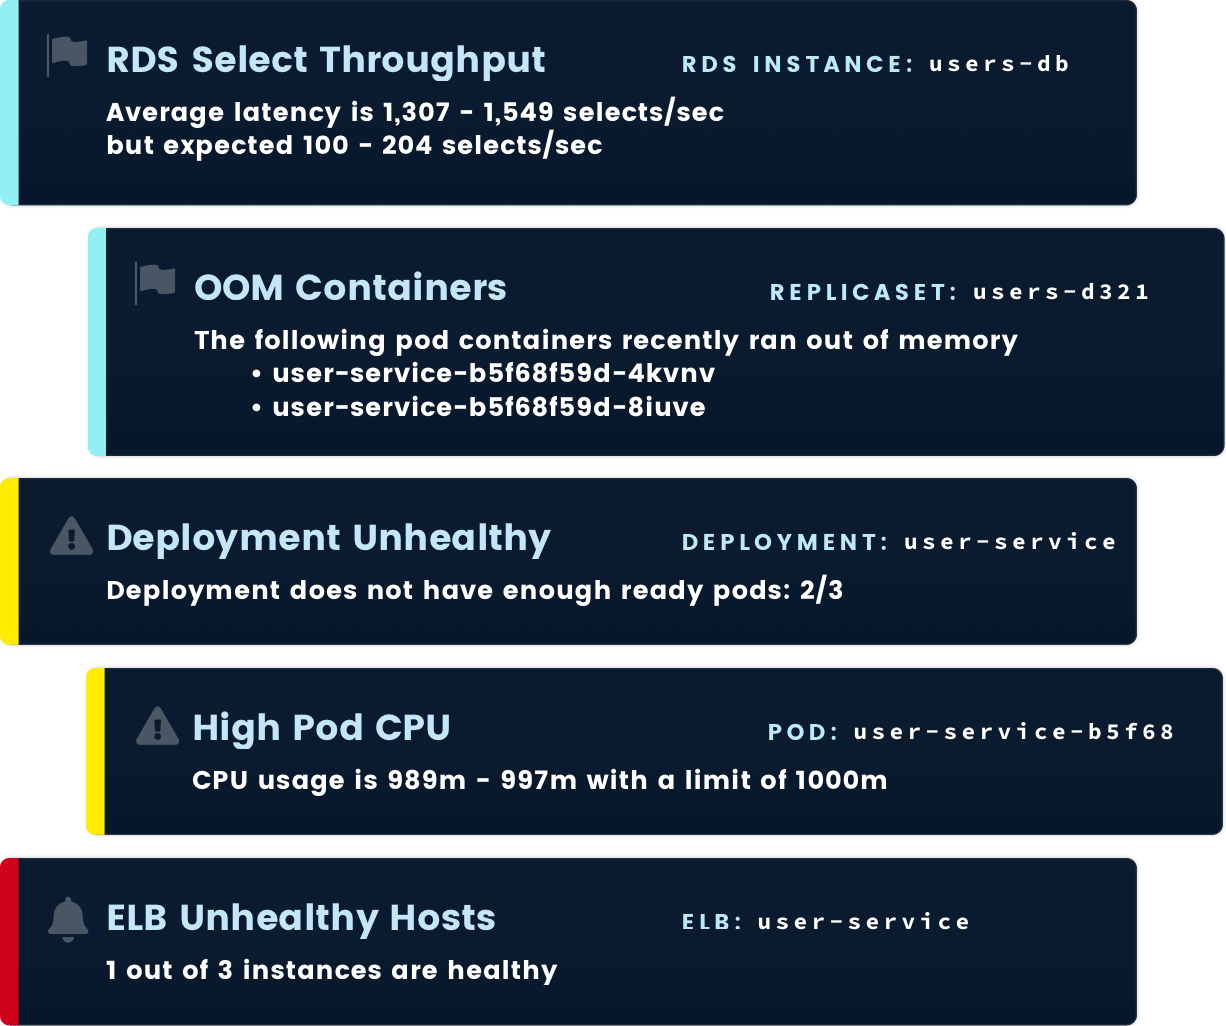
Just install our agent as a daemonset in your cluster and Blue Matador will automatically monitor all components of your Kubernetes cluster, finding issues like OOM containers, unhealthy deployments, failing nodes, and more.
As your Kubernetes cluster changes and scales, Blue Matador automatically covers new resources and changing configuration. No manual scaling or updating needed.


Blue Matador provides a beautiful, dark-mode, pre-configured dashboard and graph visualization out-of-the-box, no need to integrate with other graphing tools.

“I don’t want to spend time setting up thresholds for each service, each node, what is too little memory, etc. I don’t want to be setting manual triggers on all my metrics. I can just install the agent and forget it. The ease of install and ease of use has been great.”
– Jacob Tirey, Lead Site Reliability Engineer at Patrocinium

Blue Matador can monitor Kubernetes clusters running anywhere, whether you’re on AWS, Azure, GCP, or on-prem.


World's fastest setup
With other solutions, you have to spend a huge amount of time telling it what you want to monitor. Blue Matador watches everything immediately upon setup.
No manual alarm creation
Blue Matador is the most hands-free, easy to use, and instantly effective way to fully monitor your Kubernetes environment.
Constant vigilance
If you scale up or launch more services, Blue Matador automatically detects and monitors your new resources without any input needed from you.