Imagine a user exporting a PDF from an entirely cloud-based web app. When they try to download the file, they are greeted with an ugly 503 error (server not available). Frustrated, the user leaves the site because they don't trust the service to deliver a working product, and they turn to a desktop app that can.
Unfortunately, incidents like this happen all the time. Possible root causes include a server not purging its cache of other PDF exports, too many simultaneous requests by other users, or an uncaught bug in production code, among others.
Because server logs hold the data that reveal what went wrong in these kinds of scenarios, these are usually the first places developers go to solve problems in production. And that's why application performance monitoring (also called application performance management, depending on who you're talking to), is so critical to fixing and preventing app downtime.
One of the problems of APM is that it is still a relatively new practice. That means, as with many DevOps processes, APM is constantly moving and changing definitions. To get a pulse on APM, we often look at Gartner, especially because they have a Magic Quadrant tracking it. Gartner defines APM as:
one or more software and hardware components that facilitate monitoring to meet five main functional dimensions: (1) end-user experience monitoring (EUM), (2) runtime application architecture discovery modeling and display, (3) user-defined transaction profiling, (4) component deep-dive monitoring in application context, and (5) analytics.
Let's take a look at what APM is and how logging fits in for more optimal app performance.
"Send Me the Logs"
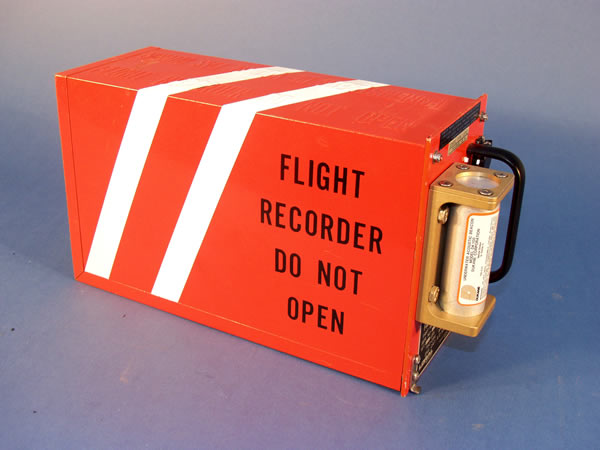
This is the phrase you'll often hear when you ask a dev about a problem in a production environment. Whether it's a crash report, a system console, or a server log, log files store server data like a black box records flight data on a commercial airline trip. And just like the black box is one of the first things respondents look for in a commercial airline crash, logs are the first place to go for a server crash (or issue).

Fact: Black box flight recorders aren't actually black. They're bright orange or red to make them easier to find in the event of a plane crash. Why a bright color? Imagine trying to find a little black box amongst aircraft wreckage. Fortunately, for finding log files, there's always grepping the /var/logs folder with regexes.
This landmark blog post in APM history helped set the tone and pace for APM providers to aspire to. We'll draw a lot from it.
Focus Logs Around the End User Experience (EUE)
APM is all about the translation of IT metrics into business value. In other words, how can your system data help you make better decisions and more competitive advantages? By focusing on the end user experience. Having a sluggish app isn't going to retain users any faster than a dialup modem is going to download that next Ubuntu LTS release next year. Having a throttled user experience can be alleviated by cloud monitoring software the load bottlenecks in a user's journey across your service or app. And — you guessed it — those bottlenecks are identified by data from log files.
Top-Down Monitoring
Like an eagle has a sharp aerial view of its surroundings, an IT team needs to have a insightful overview of its architecture. Top-down monitoring includes user experiences (the "top" of your service or app) and KPIs, or key performance indicators. KPIs vary from organization to organization.
Metrics for KPIs and user experiences can come from your bots, crawlers, and other probes you might have monitoring the performance of your system. The data from these tools comes from — you guessed it — log files. Centralizing them in one place makes a lot of sense, especially when it comes to addressing incidents in production (more on that below).
Bottom-Up Monitoring
Bottom-up is all about events and correlating them together. Many architectures have events occurring on disparate nodes, making log aggregation a must for effective monitoring. Whether those are cloud nodes, on-prem, or a mix of both, automating this will save your team lots of time with bottom-up monitoring in the APM cycle. The result will be a ground-level view of your systems' events, traced to the roots of potential incidents.
Incident Management
Though the term "incident" has a negative connotation (and rightly so), an incident is really just a system event, good or bad. Because servers can handle thousands of events at a time, it becomes a lot to manage really quickly.
Log files from events can balloon to gigabytes or even terabytes in a matter of hours, especially in situations like big-box retailers' website transactions on Cyber Monday. Maintaining adequate SLAs can also be a burden for DevOps staff during peak times.
It's always great closing out the post-mortem on an incident so you can move on, but getting there is much easier with centralized logging automating a lot of the digging work for you.
Reporting Metrics
The last and perhaps most integral part of APM revolves around real-time performance data coming straight from the app. Remember, APM is about translating IT metrics into business value. Setting correct metric thresholds for alerts can be a daunting task for accurate reporting, and dealing with seemingly never-ending false positives is really annoying (it leads to a clinical condition called alert fatigue).
Worse, having to manually set up alerts is a conundrum: How do you know what thresholds to set if you haven't experienced the associated downtime that results from not fixing the incidents pertaining to said threshold? Past experience is helpful, sure, but wouldn't it be better to prevent the stumble before the fall?
Centralized logging with your APM software can help you achieve this for each aspect of the application performance management cycle. By pairing APM and logging together, you get a holistic view of your performance and the data to back it up. Mean time to resolution will decrease as you simultaneously improve uptime. Just remember that APM works better together with log management.


