- Home
- Blog
- Kubernetes
- Post Mortem: Kubernetes Node OOM
![]()
Production issues are never fun. They always seem to happen when you’re not at work, and the cause always seems to be silly. We recently had issues in our production Kubernetes cluster with nodes running out of memory, but the node recovered very quickly without any noticeable interruptions. In this blog we will go over the specific issue that happened in our cluster, what the impact was, and how we will avoid this issue in the future.
The First Occurrence
5:12 pm - Saturday, June 15 2019
Blue Matador (yes we monitor ourselves!) creates an alert saying that one of the Kubernetes nodes in our production cluster had a SystemOOM event
5:16pm
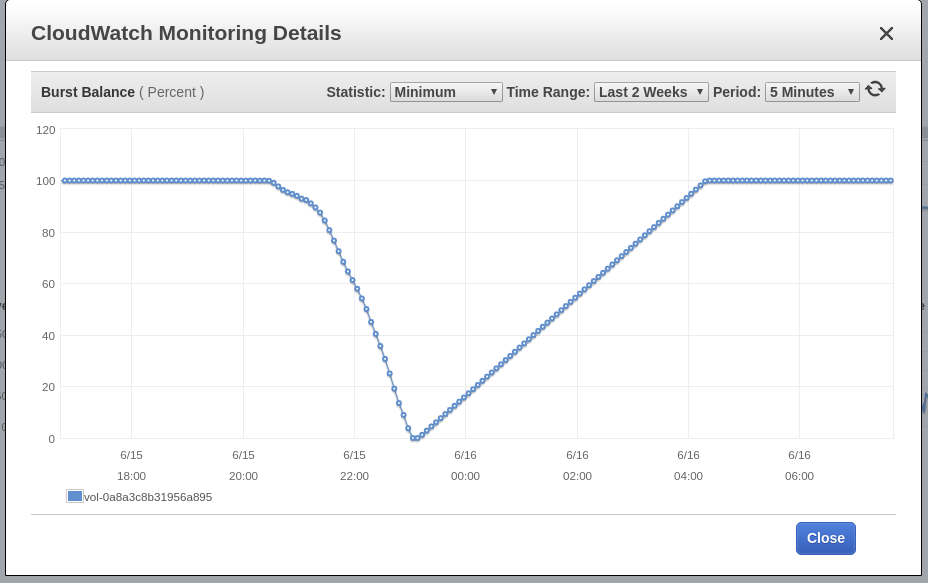
Blue Matador creates a warning saying that EBS Burst Balance is low on the root volume for node that had a SystemOOM event. While the Burst Balance event came in after the SystemOOM event, the actual CloudWatch data shows that burst balance was at its lowest point at 5:02pm. The delay is due to the fact that EBS metrics are consistently 10-15 minutes behind, so our system cannot catch everything in real-time.

5:18pm
This is when I actually notice the alert and warning. I do a quick kubectl get pods to see what the impact is, and am surprised to see that zero of our application pods died. Using kubectl top nodes also does not show that the node in question is having memory issues -- it had already recovered, and memory usage was at ~60%. It’s just after 5 o’clock, and I did not want my Session IPA to get warm. After confirming that the node was healthy, and no pods were impacted, I assumed there must have been a fluke. Definitely something I can investigate on Monday.
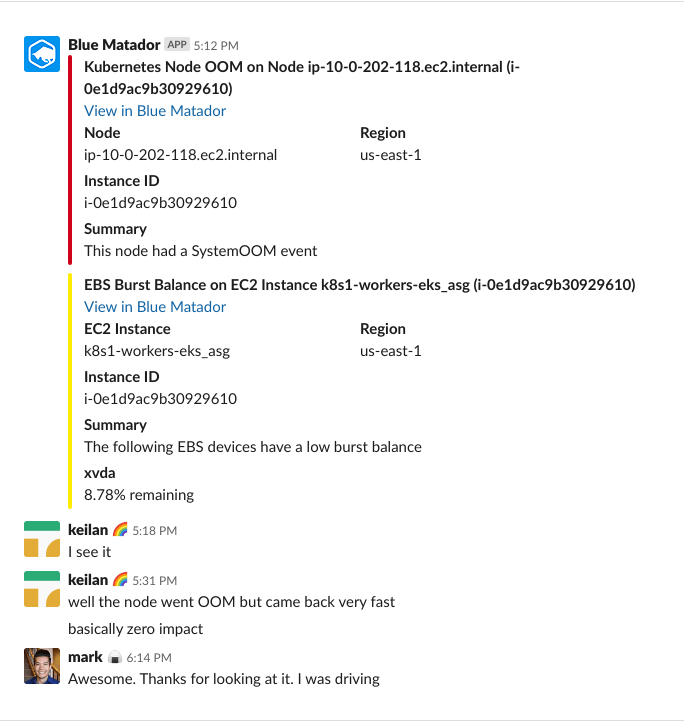
Here’s the entire Slack conversation between myself and the CTO that evening:

The Second Occurrence
6:02pm - Sunday, June 16 2019
Blue Matador generates an alert that a different node had a SystemOOM event. My CTO must have been staring at his phone, because he immediately responds and has me jump on the event since he can’t access a computer (time to reinstall Windows again?). Once again, everything seems fine. None of our pods have been killed, and node memory usage is sitting just below 70%.
6:06pm
Once again Blue Matador generates a warning for EBS Burst Balance. Since this is the second time in as many days that we had an issue, I can’t let this one slide. CloudWatch looks the same as before, with burst balance declining over around 2.5 hours before the issue occurred.
6:11pm
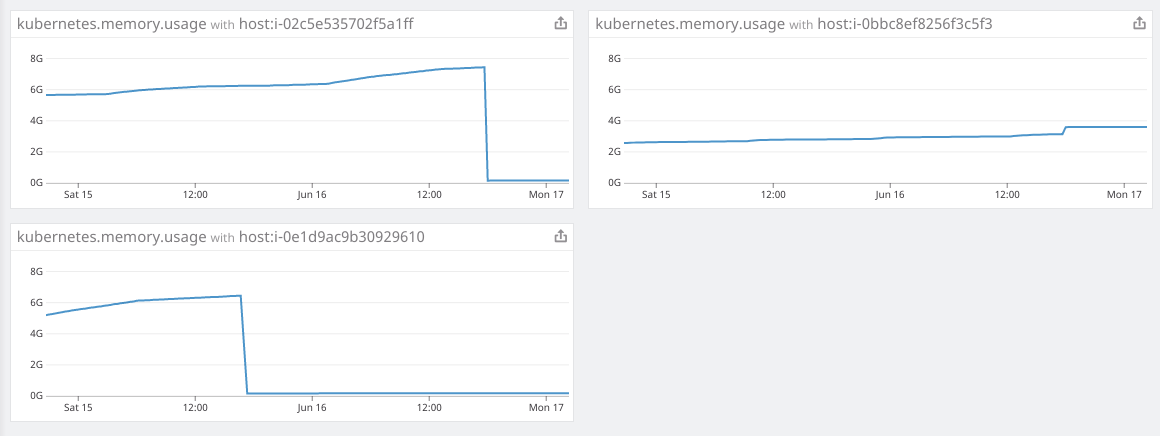
I log into Datadog and take a look at memory consumption. I notice that the node in question did indeed have high memory usage right before the SystemOOM event, and am able to quickly track it down to our fluentd-sumologic pods.
You can clearly see a sharp decline in memory usage right around the time the SystemOOM events happened. I deduce that these pods were the ones taking up all the memory, and when the SystemOOM happened, Kubernetes was able to figure out that these pods can be killed and restarted to reclaim all the memory it needed without affecting my other pods. Very impressive, Kubernetes.
So why didn’t I notice this on Saturday when I tried to see which pods had restarted? I’m running the fluentd-sumologic pods in a separate namespace, and did not think to look there in my haste.
Takeaway 1: Check all your namespaces when checking for restarted pods
With this information I’m able to calculate that the other nodes will not run out of memory within the next 24 hours, but I go ahead and restart all the sumologic pods anyways so they are starting out at low memory. Sprint planning is the next morning, so I can work this issue into my normal work week without stressing too hard on a Sunday evening.
11:00pm
Just finished one of the new episodes of Black Mirror (I actually liked the Miley one) and decided to check up on things. Memory usage looks fine, I am definitely okay to let things settle for the night.
The Fix
On Monday I’m able to dedicate some time to this issue. I definitely don’t want to deal with this every evening. What I know so far:
- The fluentd-sumologic containers are using a lot of memory
- Before the SystemOOM, there is a lot of disk activity, but I don’t know what
At first I thought the fluentd-sumologic containers would be using a lot of memory if there was a sudden influx of logs. After checking Sumologic though, I can see that our log usage has been fairly steady, and there was no increase in log data around the times we had issues.
Some quick googling led me to this github issue which suggests that some Ruby configuration can be used to keep memory usage lower. I went ahead and added the environment variable to my pod spec and deployed it:
        env:
        - name: RUBY_GC_HEAP_OLDOBJECT_LIMIT_FACTOR
          value: "0.9"
While I’m looking at my fluentd-sumologic manifest, I notice that I did not specify any resource requests or limits. I’m already suspicious that the RUBY_GCP_HEAP fix will do anything amazing, so specifying a memory limit makes a lot of sense at this point. Even if I cannot fix the memory issue this time, I can at least contain the memory usage to just this set of pods. Using kubectl top pods | grep fluentd-sumologic I can get a good idea of how much resources to request:
        resources:
          requests:
            memory: "128Mi"
            cpu: "100m"
          limits:
            memory: "1024Mi"
            cpu: "250m"
Takeaway 2: Specify resource limits, especially for third-party applications
Follow-up
After a few days I was able to confirm that the above fix worked. Memory usage on our nodes was stable and we were not having any issues with any component in Kubernetes, EC2, or EBS. I realize how important it is to set resource requests and limits for all of the pods I run, so it’s now on our backlog to implement some combination of default resource limits and resource quotas.
The last remaining mystery is the EBS Burst Balance issues that correlated with the SystemOOM event. I know that when memory is low, the OS will use swap space to avoid completely running out of memory. But this isn’t my first rodeo, and I know that Kubernetes won’t even start on servers that have swap enabled. Just to be sure, I SSH’d into my nodes to see if swap was enabled using both free and swapon -s, and it was not.
Since swapping is not the issue, I actually do not have any more leads on what caused the increase in disk IO while the node was running out of memory. My current theory is that the fluentd-sumologic pod itself was writing a ton of log messages at the time, perhaps a log message related to the Ruby GC configuration? It’s also possible that there are other Kubernetes or journald log sources that become chatty when memory is low, and I may have them filtered out in my fluentd configuration. Unfortunately, I do not have access to the log files from right before the issue occurred anymore, and do not have a way to dig deeper at this time.
Takeaway 3: Dig deeper for the root cause on all issues you see while you still can
Conclusion
Even though I do not have a root cause for every issue I was seeing, I am confident that I do not need to put more effort into preventing this issue again. Time is valuable, and I’ve already spent enough time on this issue and then writing this post to share. Since we use Blue Matador, we actually have very good coverage for issues like this, which allows me to let some mysteries slide in favor of getting back to work on our product.


