![]() Since Amazon released AWS Lambda in late 2014, the notion of serverless applications and function-as-a-service has steadily gained steam. Being able to focus on application code and simplifying infrastructure management is alluring, but traditional monitoring methods are no longer applicable. With less visibility, it becomes even more important to take advantage of the available monitoring methods. In this post, we discuss two monitoring methods, CloudWatch Metrics and CloudWatch Logs. We’ll explain how to use them and what is important to watch.
Since Amazon released AWS Lambda in late 2014, the notion of serverless applications and function-as-a-service has steadily gained steam. Being able to focus on application code and simplifying infrastructure management is alluring, but traditional monitoring methods are no longer applicable. With less visibility, it becomes even more important to take advantage of the available monitoring methods. In this post, we discuss two monitoring methods, CloudWatch Metrics and CloudWatch Logs. We’ll explain how to use them and what is important to watch.
How to Use CloudWatch Metrics with Lambda
When you're monitoring Lambda, one of the best ways to keep an eye on things is to watch CloudWatch metrics. Lambda publishes many metrics to CloudWatch, and looking for abnormalities in these metrics is a great way to spot issues in your Lambda functions. However, some metrics are more valuable than others. Here are the ones you should be watching.
Invocations
The Invocations metric measures the number of times your function is invoked. This metric is particularly important to watch as it has a direct effect on your AWS costs. It’s not uncommon to hear about Lambda users who run up big bills when a bug causes their invocations to get out of control. Therefore, it’s important to be watching this metric for spikes so you can shut it down before things get out of hand.
(We've also created a tool that can help you predict your Lambda costs based on previous usage, which is another great way to make sure you don't wind up with a jump in costs.)
The most useful aggregation for the Invocations metric is Sum. You should set a CloudWatch alarm, but you’ll have to determine a baseline that fits your workload. Since it’s a simple threshold alarm and CloudWatch doesn’t have anomaly detection, you’ll probably have to reassess it if your workload changes.
Errors
The Errors metric is incremented any time your function fails to run successfully. Obviously, it’s important to know if your function is failing due to errors. To calculate the error rate of your function, divide Errors by Invocation.
The most useful aggregation for this metric is Sum. You might be tempted to set your CloudWatch alarm to alert when there are any errors at all (i.e., setting the threshold to 0), but it’s often the case that with distributed systems a small number of errors is normal. Use the historical value of this metric to determine a good threshold.
Duration
Duration measures how long it takes to run your function in milliseconds. Functions can time out, and the longer your functions run, the more you’ll be charged, so you’ll want this metric to be as low as possible.
The most useful aggregation for this metric is Average. To set a CloudWatch alarm for this metric, look at the historical value to determine what a normal duration for your function looks like and pick a threshold. Check your threshold against the Max aggregation to make sure your alarm won’t fire for false positives.
Throttles
Finally, the Throttles metric measures the number of times your function is throttled. This happens when you hit the concurrency limit for your account.
The most useful aggregation for this metric is Sum. Set a CloudWatch alarm for any time this value is above 0. If your Lambda function is being throttled, you should take action to avoid using up your concurrency allocation.
How to View CloudWatch Metrics for Lambda
CloudWatch metrics for Lambda can be viewed normally through the Metrics portion of CloudWatch, but it is also possible to use the Monitoring tab in the Lambda function UI. This tab shows several metric graphs for each function.
How to Use CloudWatch Logs with Lambda
When you spot an anomaly in a metric, it may not always be immediately apparent what caused the problem. When this is a case, logging is helpful to gain insight on the application level of what might be the root cause. You should add log statements to your function that will help you find where things are going wrong.
For this purpose, CloudWatch Logs allow you to emit log messages in your functions that are then stored in CloudWatch.
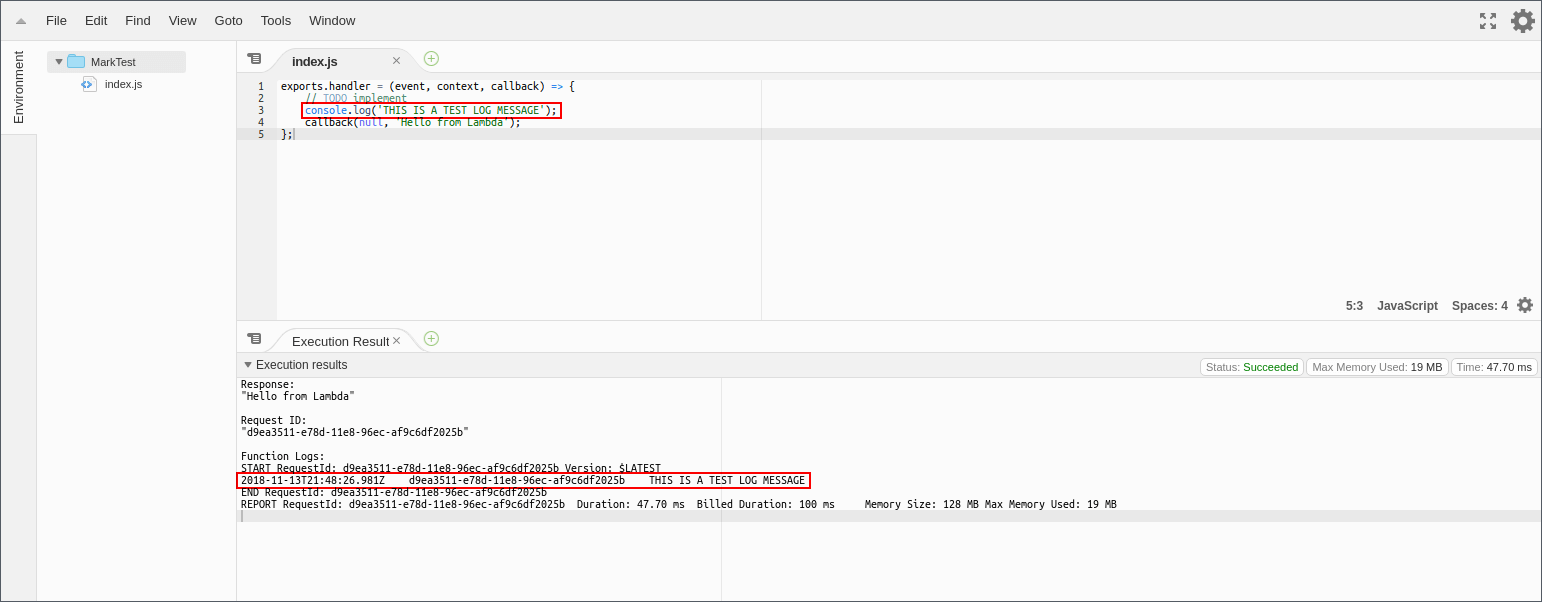
Each of the programming languages supported by Lambda have some sort of logging functionality, whether that’s Node.js’s console.log or Java’s LambdaLogger.log. Here is a list of documentation on how to send logs in each of the supported languages:
Once you’ve started writing log messages in your function, there are a number of ways to check them. The easiest is probably just to run your function from the AWS web console. Log messages are printed in the execution results.
You can also view all logs for your function in CloudWatch. Select Logs out of the menu on the left and then choose the Log Group that contains the name of your function. Within the log group, you’ll be able to access log messages emitted by your function.
An alternative to CloudWatch for monitoring Lambda
Now you know how to monitor AWS Lambda using CloudWatch. However, it can be error-prone and tedious to set up CloudWatch monitoring for all your functions (and remembering to do it for functions you create in the future is tough!). Take the manual work out of monitoring your Lambda functions and use Blue Matador’s automatic setup to effortlessly watch for anomalies and errors within Lambda.


