AWS Lambda can use stream based services as invocation sources, essentially making your Lambda function a consumer of those streams. Stream sources include Kinesis Streams and DynamoDB streams. When you allow streams to invoke your Lambda function, Lambda will emit a CloudWatch metric called IteratorAge. In this post, we discuss what this metric is and how to fix it if it’s too high.
What is iterator age?
This metric measures the age of the stream records that were just processed by your function. Monitoring IteratorAge can help you make sure your Lambda functions are keeping up with records added to your streams. The higher your iterator age, the more backed up your streams are getting. If your Lambda functions get too far behind and your iterator age exceeds the retention period on your stream, you will lose data as records are removed from the stream without being processed.
How to tell if your iterator age is too high
The definition of high iterator age is variable and depends on your use case. Obviously, exceeding your retention period is a problem, but your iterator age would likely be considered high before that becomes the case.
If your use case has requirements that records in the stream are processed within a certain amount of time, you’ll want to stay well below that threshold. Otherwise, it’s good for your iterator age to be below half of your retention period, which is AWS’s recommendation for Kinesis streams.
Troubleshooting a high iterator age
Once you’ve determined that your Lambda iterator age is too high, you’ll want to take steps to lower it. What you do depends on why your iterator age is high:
A spike in records added to your stream
Sometimes your application will cause a sudden spike in the number of records in your stream. This can happen if a producer sent many records to Kinesis, or lots of changes were made in DynamoDB. This situation is not a problem as long as your Lambda function can catch up. To tell if your Lambda function is processing the records quickly enough, monitor your IteratorAge metric in CloudWatch. A downward trending IteratorAge means you’ve got nothing to worry about. If the metric has plateaued or is increasing, you’ll need to process records faster.
Errors in function execution
If your Lambda function fails due to an exception, Lambda will continue to retry the records until the function succeeds or the failing records are lost due to the retention period. In fact, AWS documentation says the following about exceptions:
The exception is treated as blocking, and AWS Lambda will not read any new records from the shard until the failed batch of records either expires or is processed successfully
When dealing with errors in Lambda execution, there are two possible scenarios:
-
There is a bug in your function that prevents it from ever being able to handle the records. You will need to fix your function before it will be able to continue processing the stream.
-
Failures are intermittent. Determine if there’s anything you can do to fix those failures. Until you do so, your function will continue to hobble along, likely getting further behind unless you start processing records faster.
Your function is not processing records fast enough
There are a number of reasons why your function could be processing records too slowly. Each one has a different diagnosis and troubleshooting method:
Concurrency issues
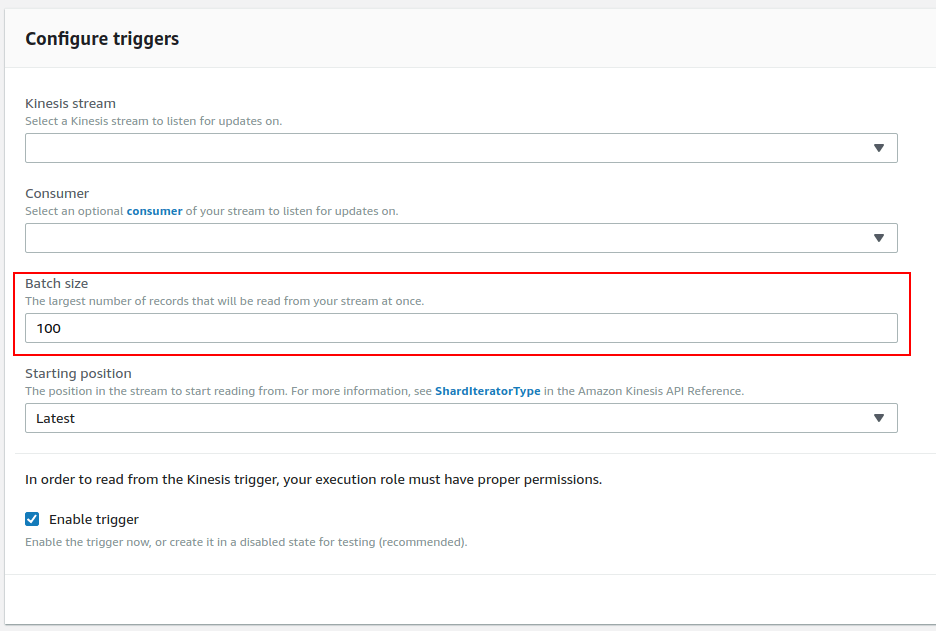
To check if your function is having concurrency issues, check its Throttles metric in CloudWatch. If your function is being throttled (ie, the metric is non-zero), you can try to resolve these issues by following our guide on throttling in Lambda. Otherwise, you can configure a larger batch size. This will allow your Lambda function to process more records per invocation and let you use your concurrency limit for sparingly.
Change the batch size from the Designer section of the Lambda interface
Memory issues
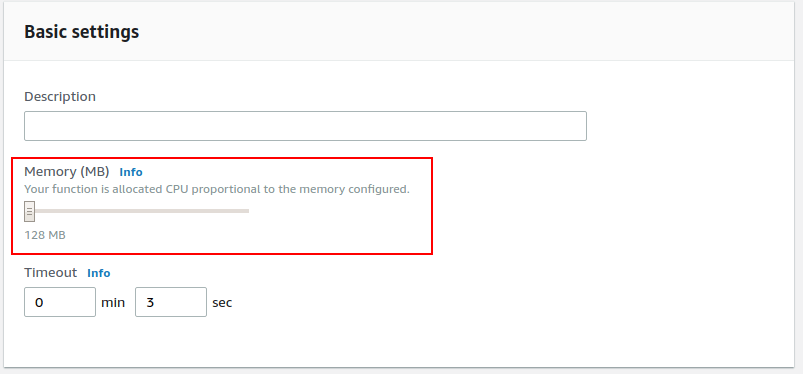
If you haven’t allocated enough memory to your function, your function could run more slowly, raising your function’s IteratorAge metric. This is especially true because Lambda allocates CPU to your function proportional to your memory. To test if memory is the bottleneck, check a CloudWatch graph for the Duration metric. If increasing the memory allocated to the function lowers the function Duration, you know that memory is what is slowing down your function. Allocate enough memory that your function will process records quickly enough to drive your IteratorAge back down to acceptable levels.
Increase your function’s memory allocation from the Basic settings card in the Lambda interface
Not enough Kinesis shards
If your function is backed by Kinesis streams, you may not have enough shards. AWS polls each shard once per second to see if there are new records, and then invokes your function once per shard where there are new records. As such, adding more shards allows you to process Kinesis records in parallel. Remember, Kinesis shards are limited to 5 reads and 2mb per second, so you’ll want to be careful if your functions are competing with other consumers for the shards.
Next Steps
It can be a real pain to monitor IteratorAge in CloudWatch for each of your functions, especially since your thresholds will be different per function. Blue Matador provides anomaly detection on IteratorAge without any configuration. Without any setup, you can know when your Lambda functions are falling behind and fix them, all without downtime or data loss.


